
|
Your commissioner, who loves you all very much, thought it would be interesting to check in at the halfway point of the season and see how the stats look for each team. I guess I was just in the mood to use Excel. I made Excel sheets for each week of the season, breaking down how each team scored their points. I ended up with seven large tables on seven sheets. I took those data and made the following chart, which shows the total number of points each team has scored, the number of points scored by each position, and the percentage each position represents. Obviously the FLEX position is tough to handle, since it could be either RB or WR. I didn't want to group FLEX in with either RB or WR depending on the week, since it could make a weak group of 3 RBs look like a strong RB corps, and likewise for WRs. You all will just have to keep that in consideration. 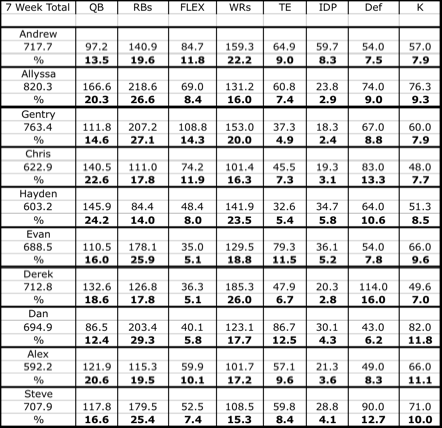 Also, these data are potentially not super useful since there have been so many injuries, trades, teams changing, etc. For example, just because Derek has easily the highest-scoring WR corps overall (thanks to Antonio Brown), that doesn't mean that Andre Holmes is a dynamite WR2 right now. It just means Antonio Brown is that good. Some of the data are surprising, so I just thought it'd be fun to check it out. I also assembled pie graphs for each of you showing the aforementioned percentages in a more visual representation. That's below. 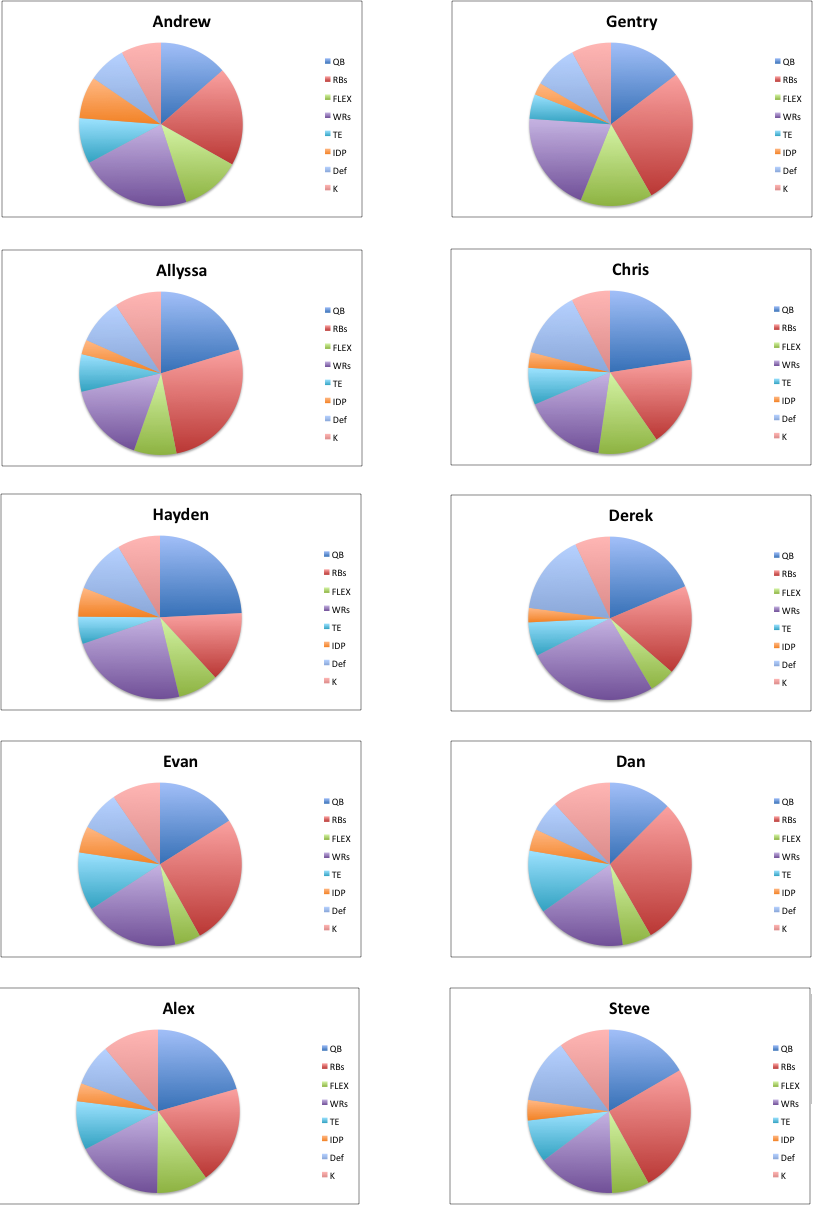 And lastly, I made a bunch of bar graphs by position, showing how we each stack up at that specific position. For example, take a look at the IDP graph, also known as the "Look How Good JJ Watt Is Graph." For the IDP position, my team has scored 60 points, with the next closest being Evan at 36. 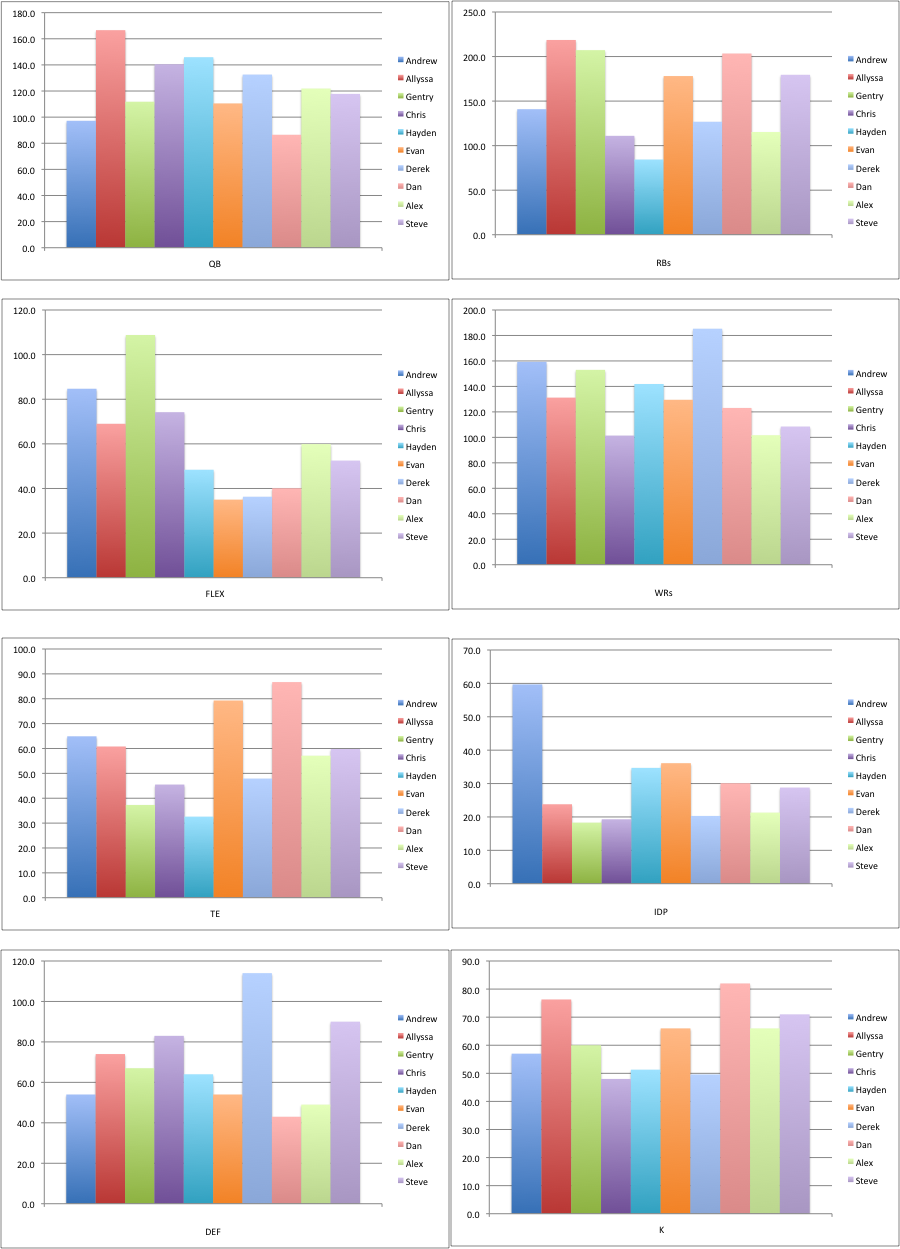 Hopefully you guys find this information interesting/fun/helpful/whatever. I'm not really sure how useful any of it is, but I just got the idea when I was doing this week's write-up and comparing Hayden and Chris' teams. I wanted to see how big their QB percentages would be, and wouldn't you know it, but they're the two largest. I'll probably do another set of graphs when we get to the end of the regular season.
0 Comments
Leave a Reply. |
By: Hayden HansonMr. Hayden Hanson (Editor in Chief) is an Accountant-extraordinaire, as well as an aspiring writer. He has written several moderately-successful self-help books, the most famous of which is "What Do You Mean You Can Smell My BO?" Gustav Travers of the New York Times praised the book as "A vulnerable, courageous look into the mind of a man who has literally no sense that other people exist. And also no sense of smell. Nope, he definitely doesn't have that either. Just musk, like a hog that's gotten into the cabbage." Archives
September 2019
Categories |
 RSS Feed
